Estimation of Air Pollution with Remote Sensing Data: Revealing Greenhouse Gas Emissions from Space
Air pllution is a major driver of climate change. Anthropogenic emissions from the burning of fossil fuels for transportation and power generation emit large amounts of problematic air pollutants, including Greenhouse Gases (GHGs). Despite the importance of limiting GHG emissions to mitigate climate change, detailed information about the spatial and temporal distribution of GHG and other air pollutants is difficult to obtain. Existing models for surface-level air pollution rely on extensive land-use datasets which are often locally restricted and temporally static. This work proposes a deep learning approach for the prediction of ambient air pollution that only relies on remote sensing data that is globally available and frequently updated. Combining optical satellite imagery with satellite-based atmospheric column density air pollution measurements enables the scaling of air pollution estimates (in this case NO2) to high spatial resolution (up to ~10m) at arbitrary locations and adds a temporal component to these estimates. The proposed model performs with high accuracy when evaluated against air quality measurements from ground stations (mean absolute error <6 microgram/qm). Our results enable the identification and temporal monitoring of major sources of air pollution and GHGs.
Background
One of the primary anthropogenic air pollutants is Nitrogen Dioxide (NO2). Elevated levels of NO2 harm the vegetation, contribute to acid rain, and act as a precursor of potent GHGs like Ozone. Additionally, NO2 is jointly emitted with CO2 during the combustion of fossil fuels at high temperatures, making it a suitable proxy to identify CO2 emission sources. This work leverages a large body of publicly available NO2 concentration measurements on the ground by the European Environment Agency’s (eea.europa.eu, EEA) network of air quality stations and satellite measurements from the European Space Agency’s (ESA) Copernicus program to investigate the distribution of air pollutants through a deep learning approach. The results of this work enable the identification of major sources of GHG emissions and their temporal monitoring on a global scale.
Approach
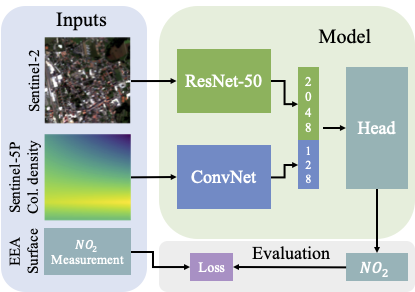
This work approaches the estimation of air pollution as a supervised computer vision problem. We collect a dataset of harmonized remote sensing data from Sentinel-2 and Sentinel-5P, spatially and temporally aligned with measurements from air quality monitoring stations. The proposed model is trained on pairs of remote sensing input and air quality target values (see Figure), which yields a system that predicts air pollution levels solely from globally available remote sensing data (code available on Github).