Visualization of Earth Observation Data with the Google Earth Engine
Earth observation provides the basis for a better understanding of our planet. The amount of data available for the creation of this understanding has steadily increased as a result of technological progress and the growth in the frequency of measurements. In research, this leads to the challenge that conducting holistic analyses and extracting relevant information from large Earth observation datasets requires significant development effort and specific expertise in cloud computing services. Therefore, user-friendly solutions are needed that combine data storage, processing and analysis. With the Earth Engine, a cloud-based platform for geospatial data analysis, Google provides a promising platform in this regard. This work evaluates the suitability of the Google Earth Engine for use in research to perform analyses of large Earth observation datasets as well as to create meaningful and easy-to-use interactive visual representations.
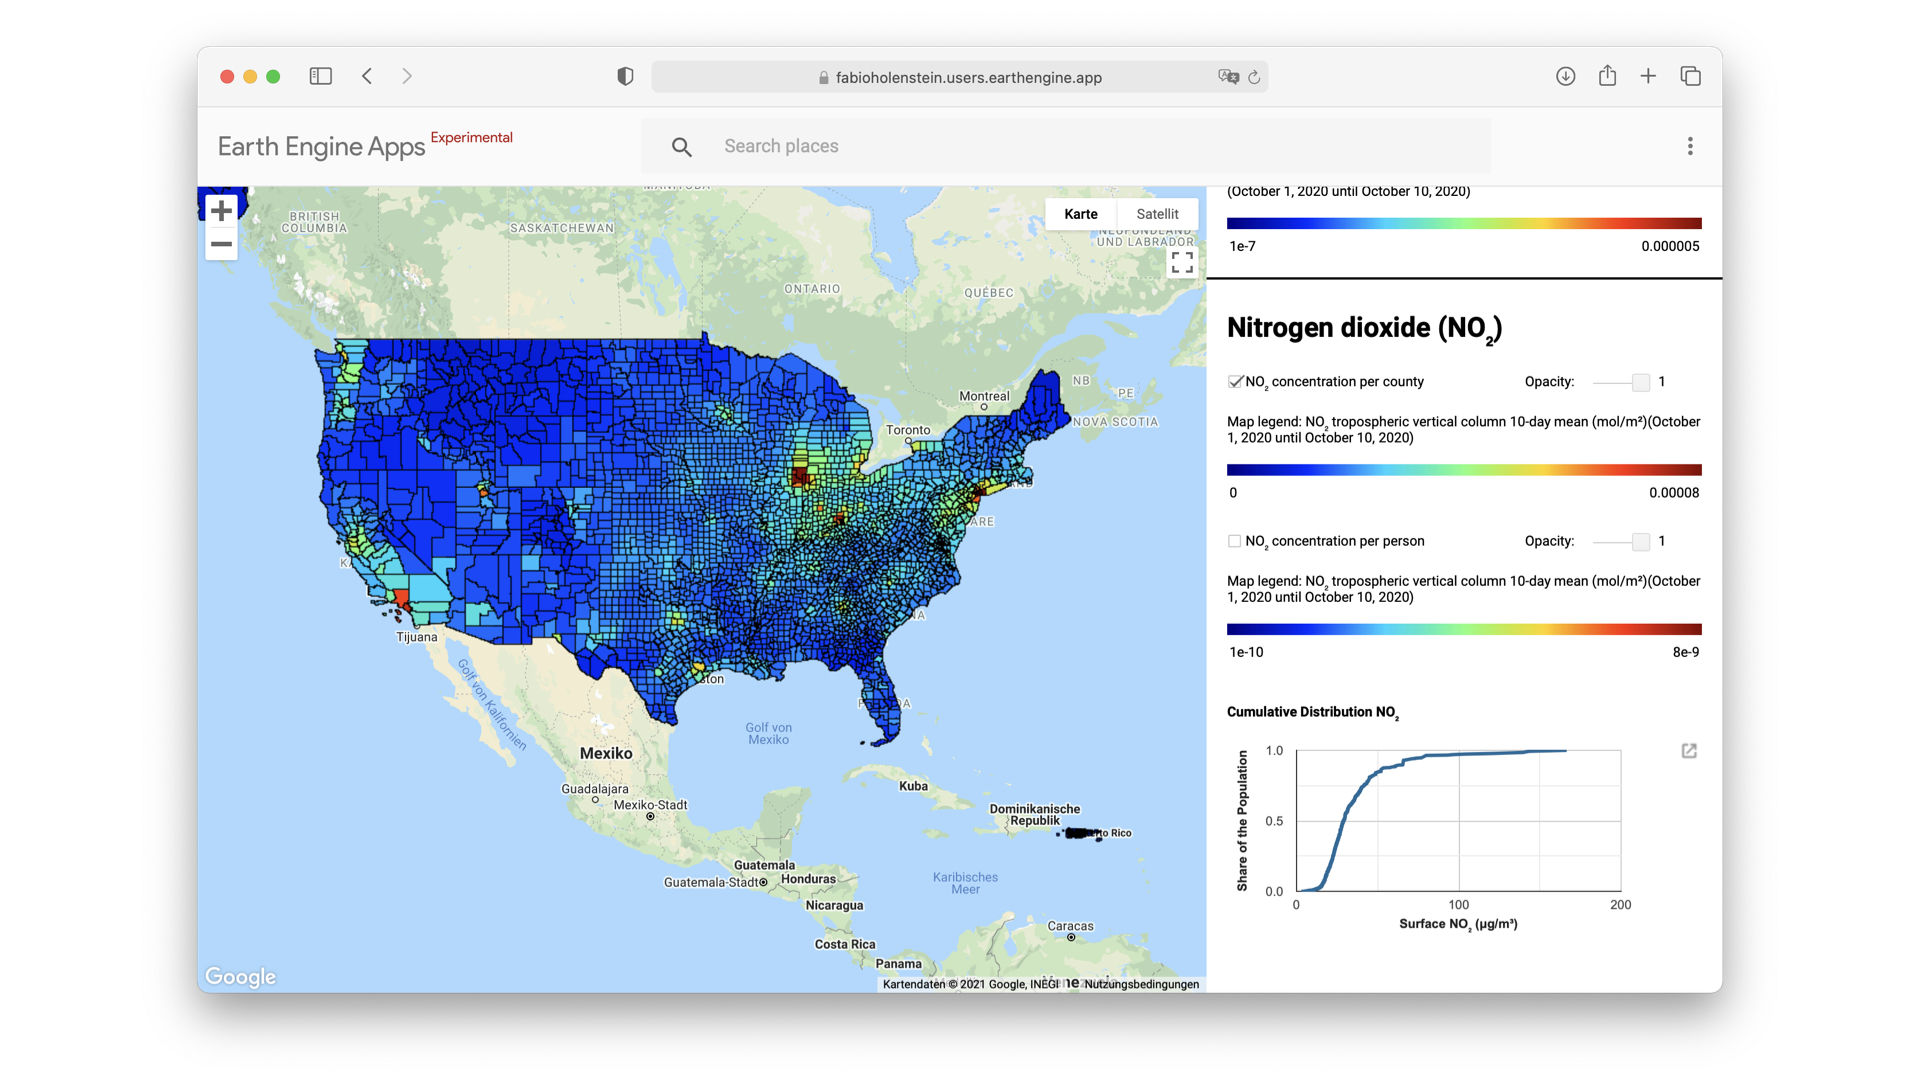
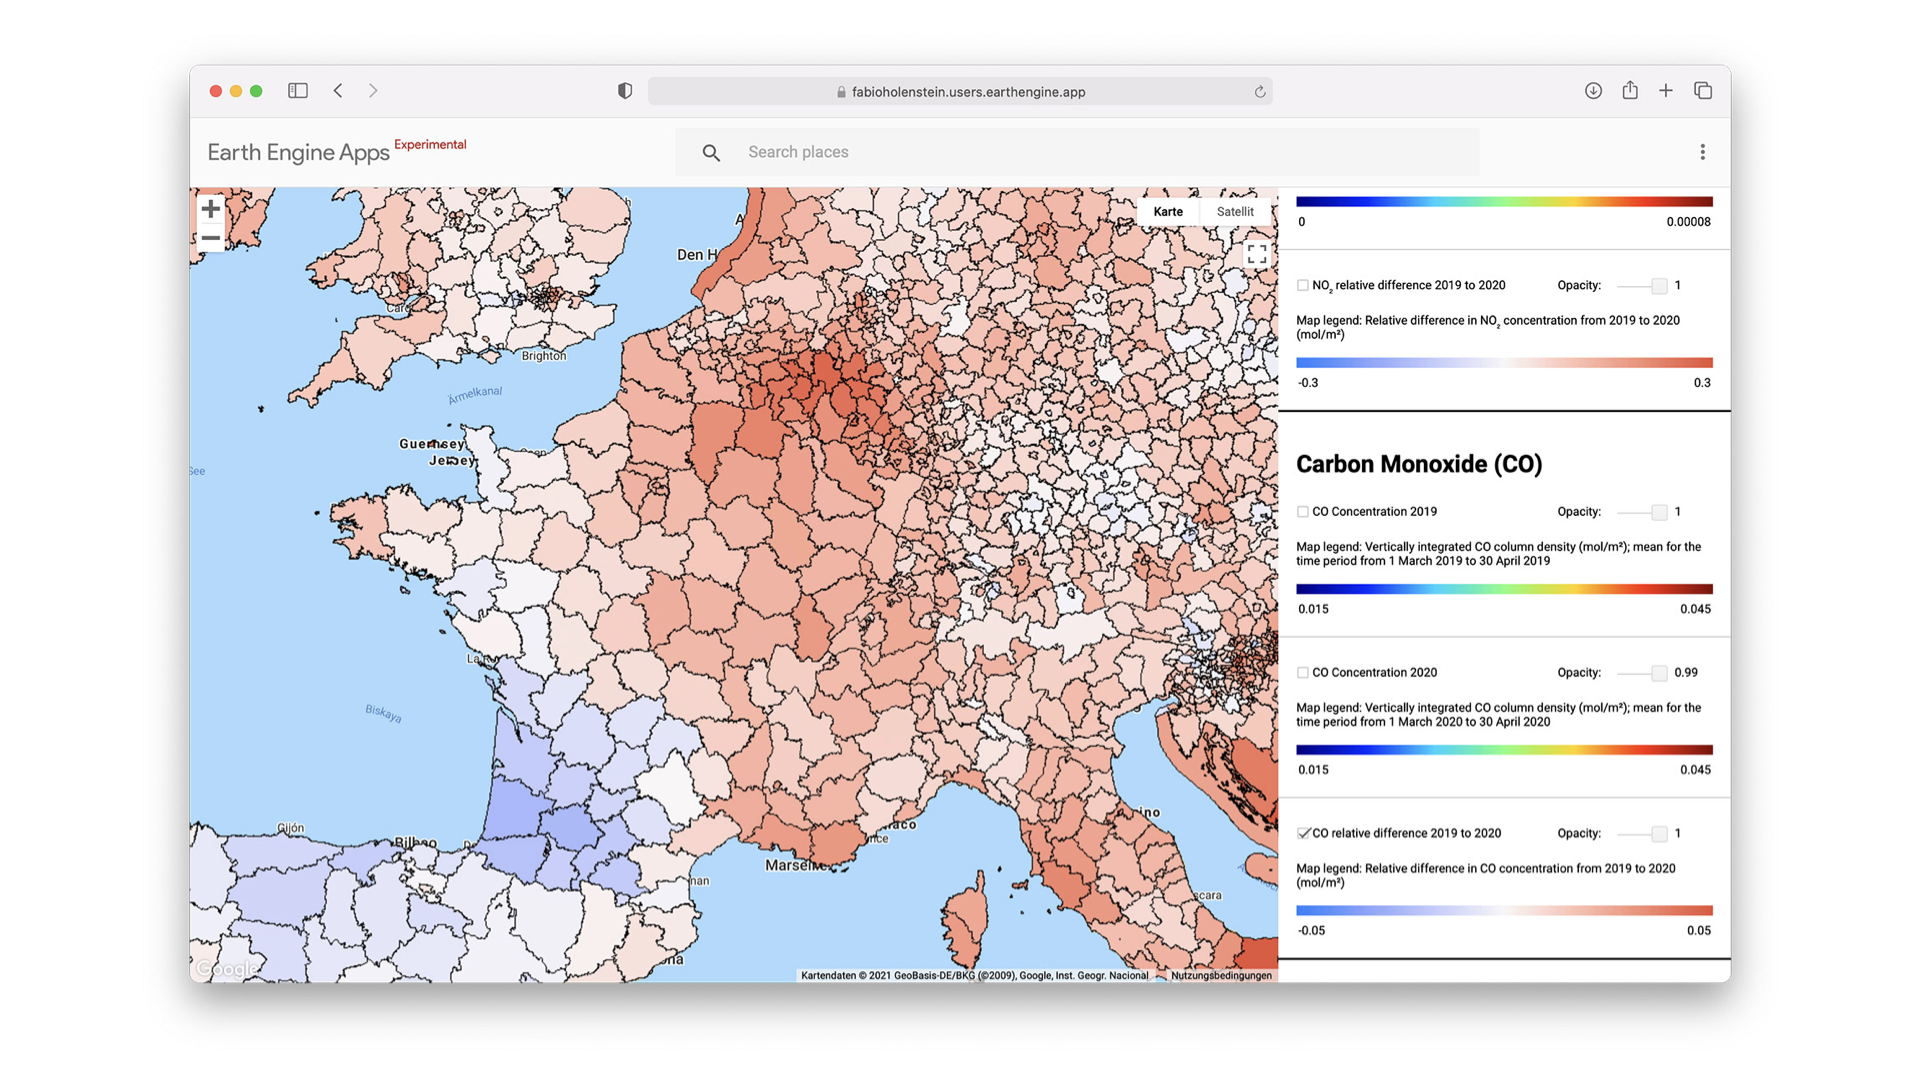
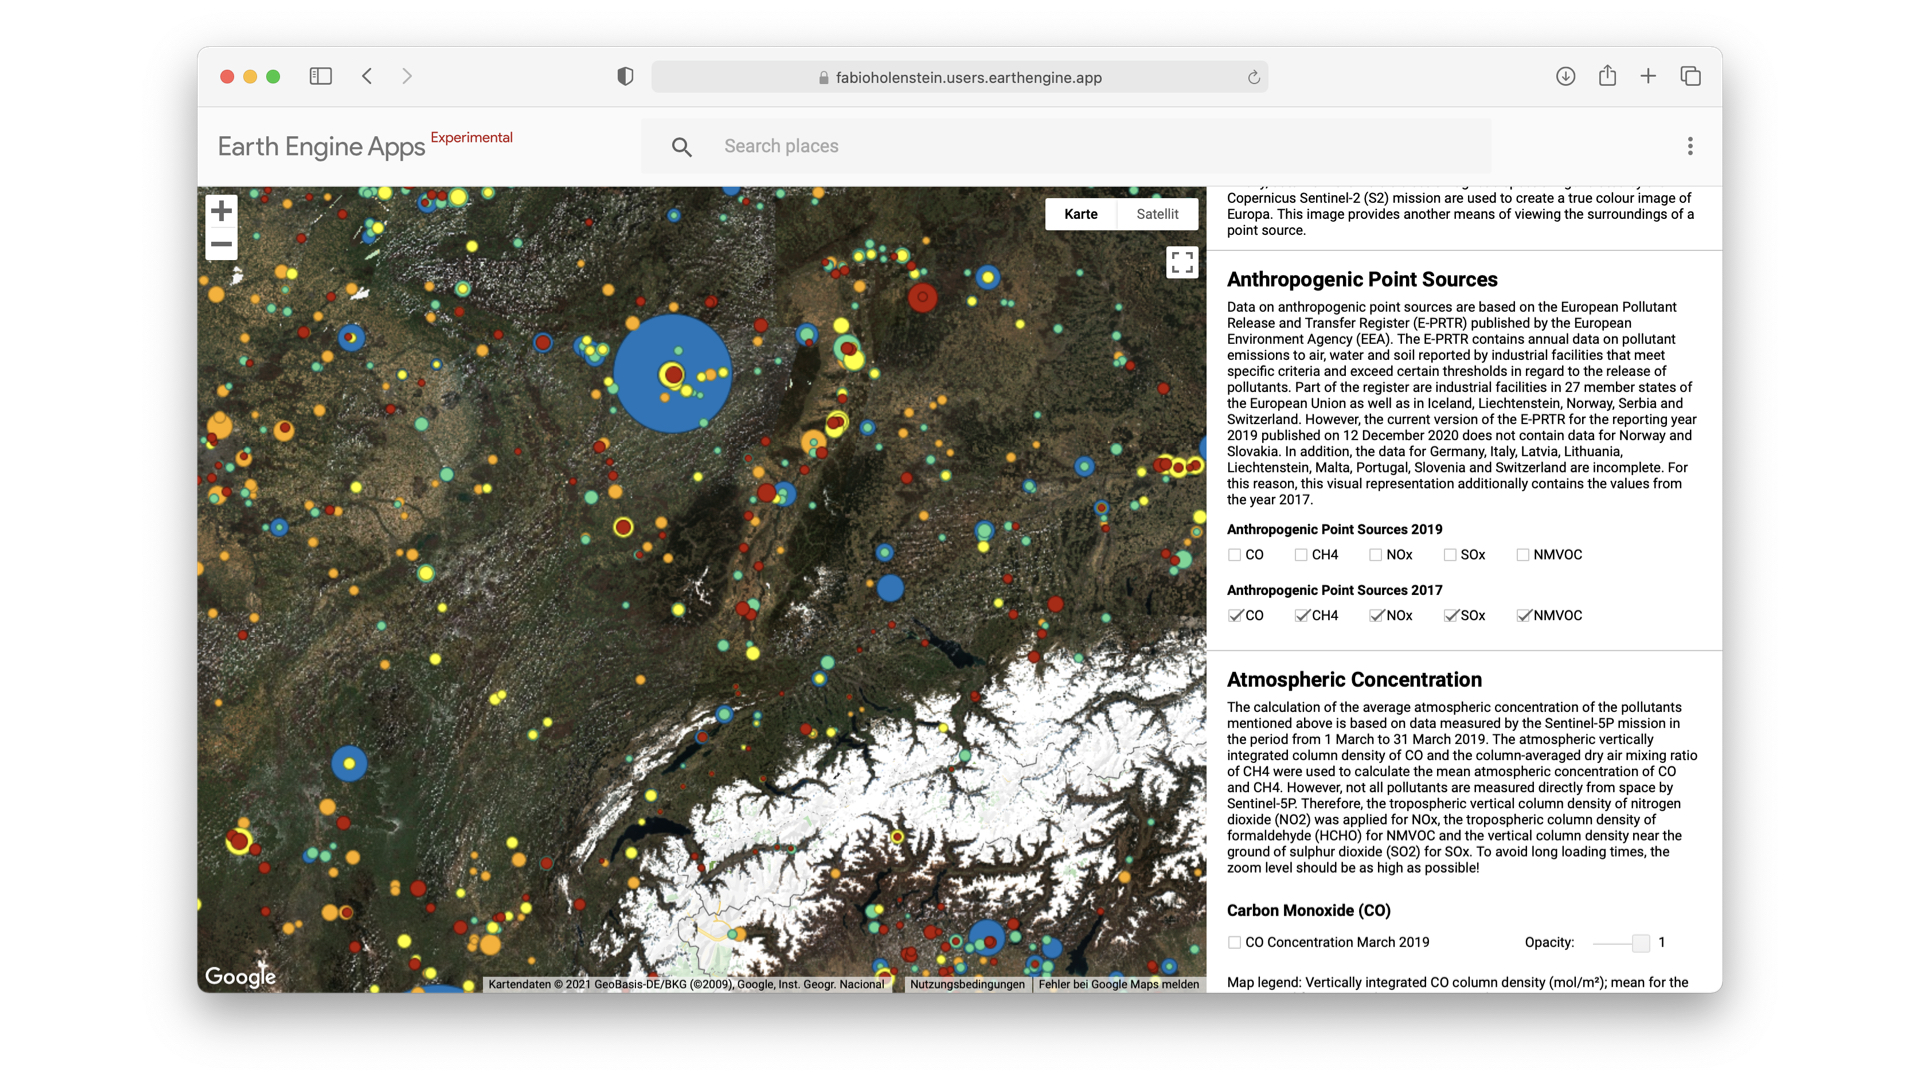
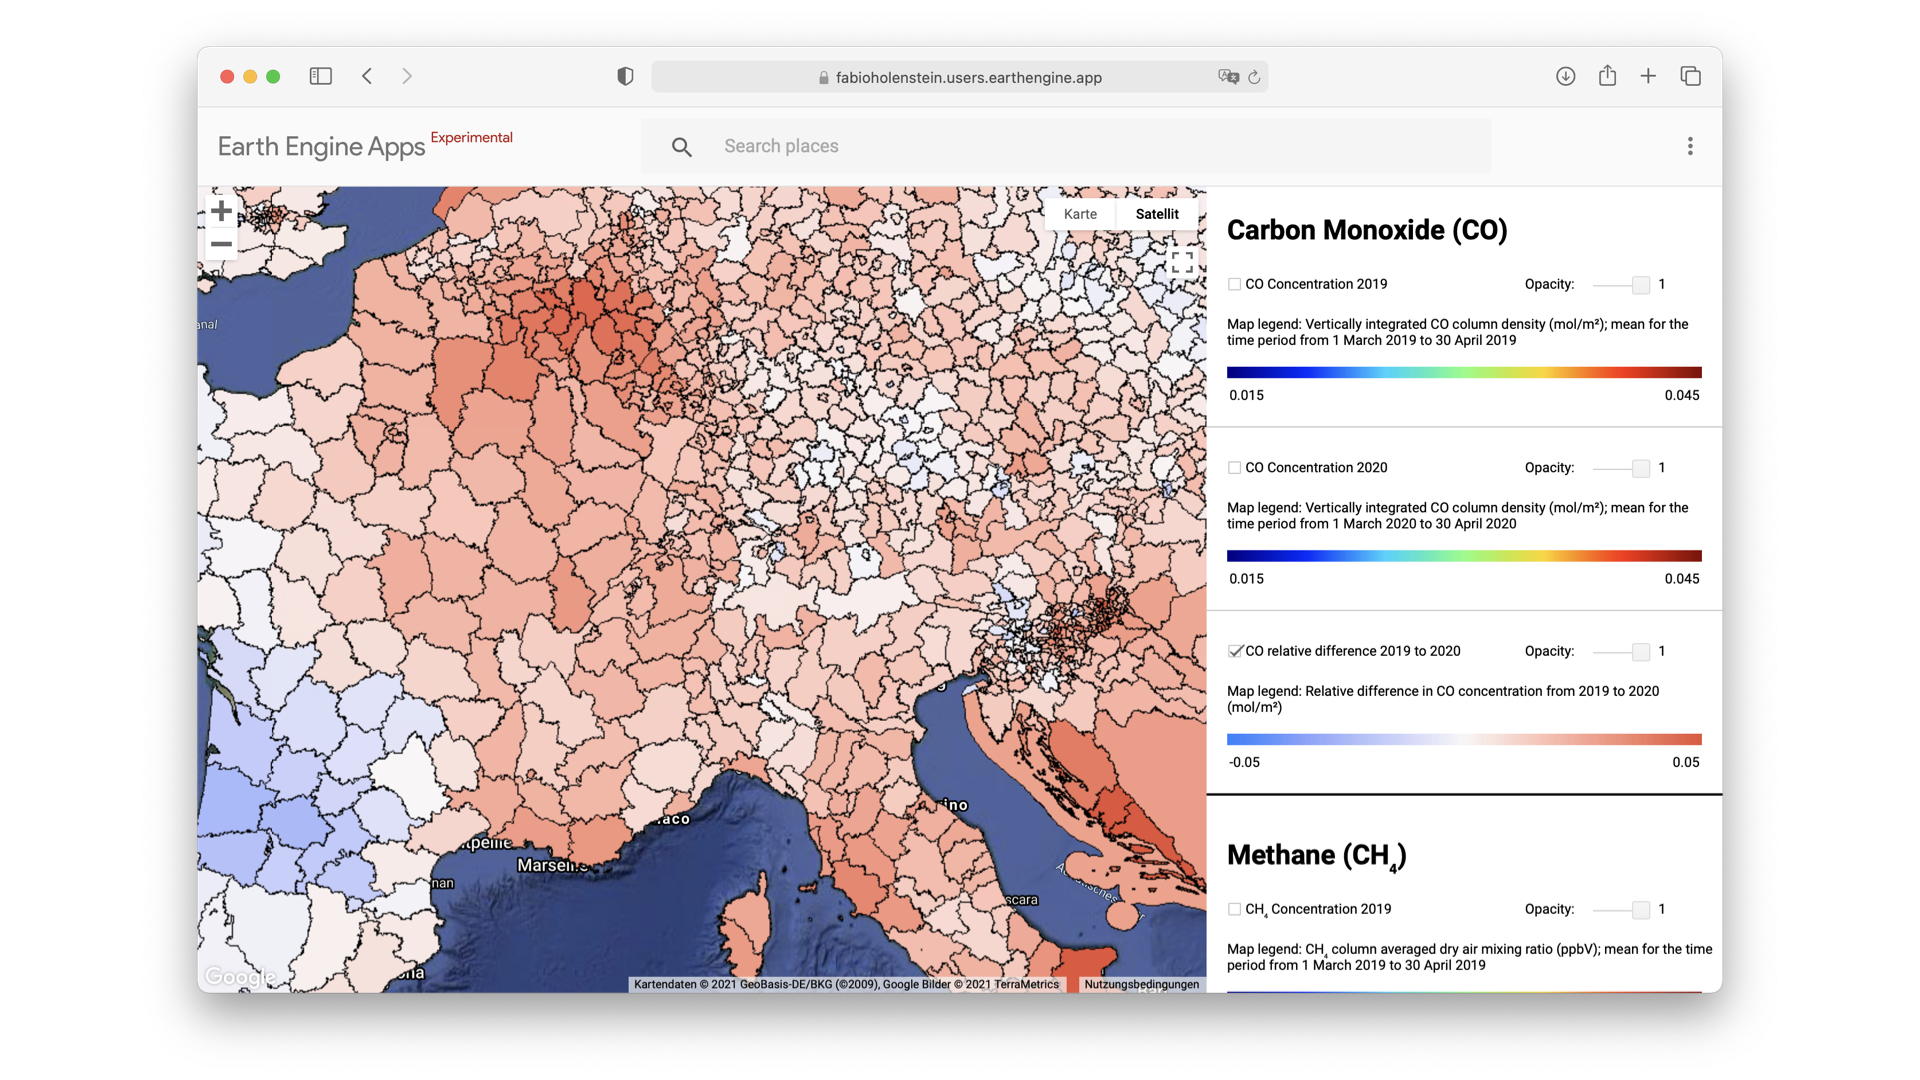
For the evaluation of the Google Earth Engine, three use cases in the context of global air pollution are conducted using datasets provided by Google and data from external sources. These use cases include the determination of anthropogenic emissions in the 3,144 counties of the USA (accessible here), the identification of anthropogenic point sources of various air pollutants in Europe (accessible here) and the estimation of the impact of COVID-19 on air pollutant levels in Europe (accessible here). Based on the three use cases as well as a usability analysis and a theoretical review, the Google Earth Engine is qualitatively evaluated in the categories infrastructure and processing, data, development of analyses and sharing of results.
The evaluation of the Google Earth Engine shows a high level of abstraction in terms of infrastructure, which significantly reduces the technical expertise needed to conduct analyses of large Earth observation datasets. By grouping related data into collections, complexity is reduced with regard to the management and processing of datasets. Moreover, with the Earth Engine Data Catalog, Google provides a large collection of datasets in pre-processed and ready-to-use form, which further simplifies conducting analyses. Methods accessible via an intuitive web-based integrated development environment, in combination with the computational infrastructure of the Earth Engine, allow the efficient execution of analyses. Visual representations in the form of Google Earth Engine Applications make it possible to provide the results of an analysis to the scientific community and other target groups in an interactive way.
Limitations in the use of the Google Earth Engine arise from the negative influence of complex vector data on the performance of visual representations. Furthermore, visual representations developed with the Earth Engine primarily enable the creation of an overview and thus a qualitative investigation of a dataset, but not comprehensive quantitative investigations.