Example images from our set of 21,350 images of industrial sites. Each column corresponds to one of 624 emitter locations. The top row shows the site during activity (smoke is present) and the bottom row during inactivity (smoke is absent). The origin region of the smoke plume is marked by red circles.

The major driver of global warming has been identified as the anthropogenic release of greenhouse gas (GHG) emissions from industrial activities. The quantitative monitoring of these emissions is mandatory to fully understand their effect on the Earth’s climate and to enforce emission regulations on a large scale. In this work, we investigate the possibility to detect and quantify industrial smoke plumes from globally and freely available multi-band image data from ESA’s Sentinel-2 satellites.

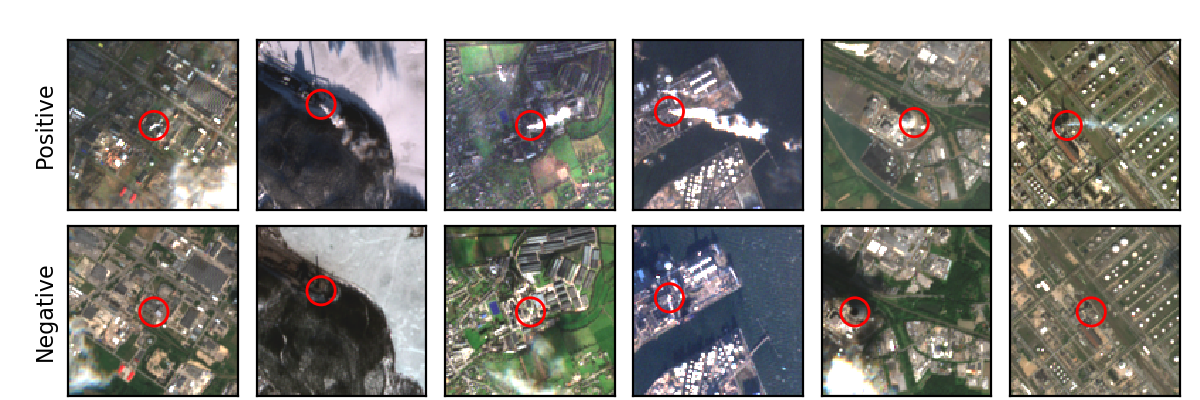
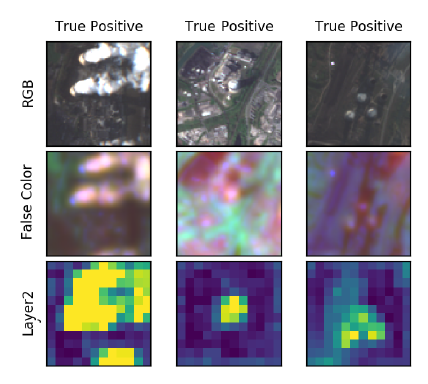
Classification of Smoke Plumes

Using a modified ResNet-50, we can detect smoke plumes of different sizes with an accuracy of 94.3%. The model correctly ignores natural clouds and focuses on those imaging channels that are related to the spectral absorption from aerosols and water vapor, enabling the localization of smoke.

Inference examples from our classification model. For different examples from our test sub-sample (columns), we show the true color RGB image (top row), a false color image (center row), and the activations of some hidden layer in our ResNet implementation (bottom row, sharing the same scaling across the row). We find that the location of smoke correlates in most cases with significant aerosol and water vapor signals and that the hidden layer activations fire based on these signals, leading to good localization of the smoke.

Segmentation of Smoke Plumes

We exploit this localization ability and train a U-Net segmentation model on a labeled sub-sample of our data, resulting in an Intersection-over-Union (IoU) metric of 0.608 and an overall accuracy for the detection of any smoke plume of 94.0%; on average, our model can reproduce the area covered by smoke in an image to within 5.6%. The performance of our model is mostly limited by occasional confusion with surface objects, the inability to identify semi-transparent smoke, and human limitations to properly identify smoke based on RGB-only images. Nevertheless, our results enable us to reliably detect and qualitatively estimate the level of smoke activity in order to monitor activity in industrial plants across the globe. Our data set and code base are publicly available.

Inference examples from our segmentation model. For different examples from our test sub-sample (columns), we show the RGB image (top row), a false color image (center row), and the footprint of the ground-truth labels (red areas) and predicted labels (green areas). In general, the segmentation model reliably identifies smoke plumes with few limitations.